Side project · 2026
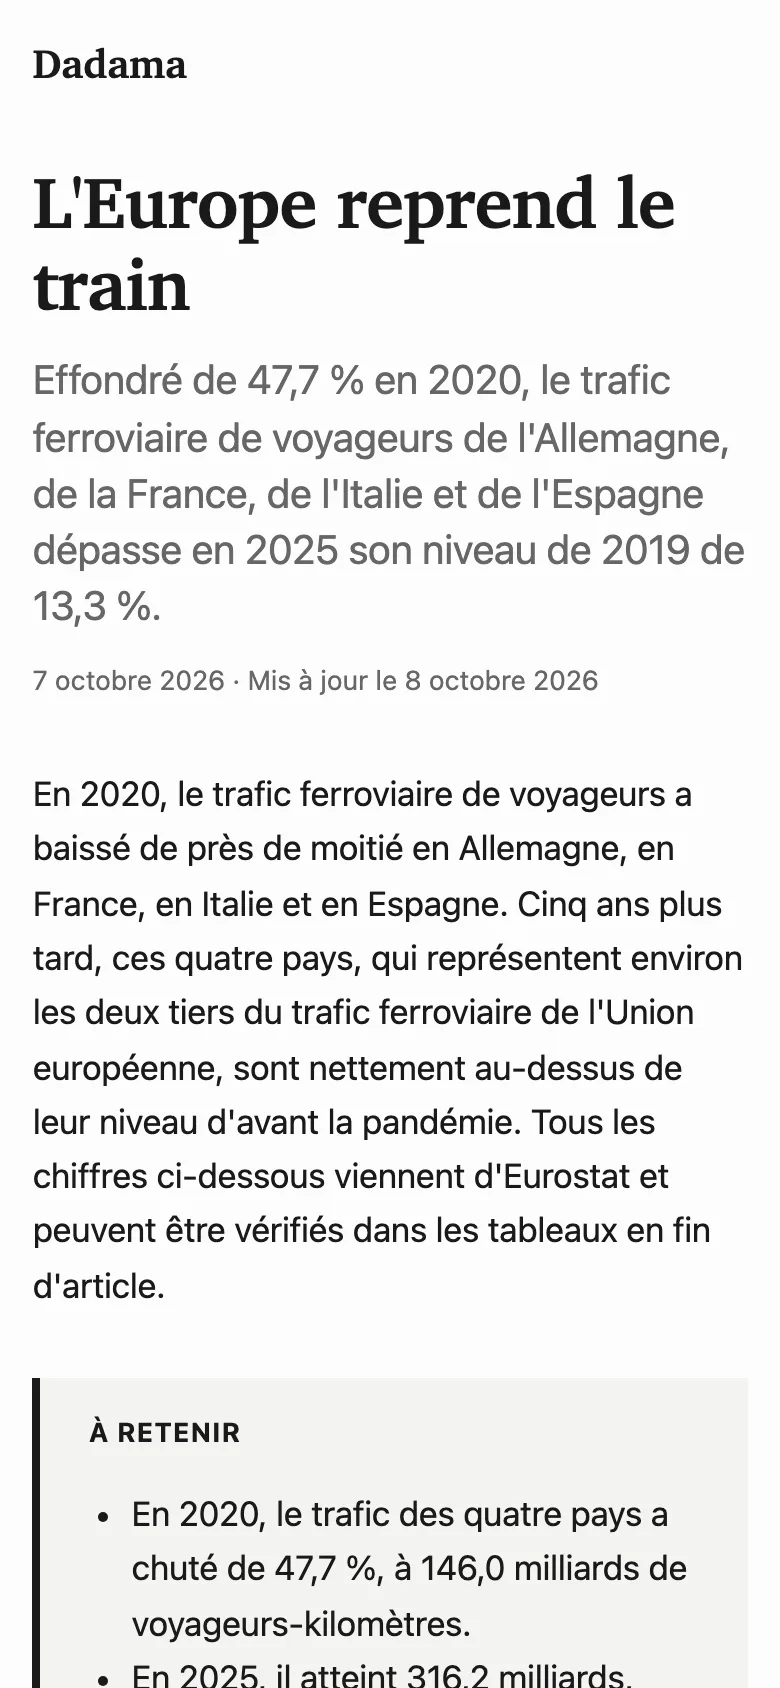
dadama — an AI-built data-journalism engine, with guardrails
A framework-free static site generator for data stories, built with Claude Code in a few days. The interesting part isn't the speed — it's the frame that kept the agent honest.
Design, product and engineering

- automated tests
- 379
- empty repo to live site
- 1 day
Context
dadama turns Markdown articles and CSV files into data stories with accessible, interactive D3 charts and scrollytelling. No framework, no database: vanilla TypeScript, built by Bun into a static site on Codeberg Pages.
I built it with Claude Code. Most of my work was not writing the code — it was designing the frame the agent works inside.
The frame
- A
CLAUDE.mdwith approval-gated rules. The stack is written down and "challengeable, but not edited without human approval". When the agent wanted to change it, it had to ask. - A phased plan, compacted as it goes.
PLAN.mdholds only what later work depends on; each finished phase is compacted into its own log, so the context stays small and current. - Decisions as ADRs. Every stack choice — Bun, D3, no database, no UI framework, the Markdown pipeline — has an architecture decision record with the options considered. A reversed decision gets a new ADR, not a silent edit.
- Tests as guardrails. 379 tests, including some that fail the build when the agent drifts: performance budgets on CSS and JavaScript weight, and accessibility checks on every chart (generated alt text, a data table for every chart, keyboard-reachable tooltips).
Outcome
The project went from an empty repository to a live static site in a day, then through two more versions in the next two. Every chart ships with a text alternative and a data table, and the build refuses to grow past its budgets.
This portfolio is built the same way.